
This article is covered in the eighth module of our course, Cycling Science: the essentials of cycling physiology and coaching.
The complete module covers:
- The principles and theory of load monitoring
- How to complete a submaximal modified LSCT test
- Setting up a monitoring template (template included) to monitor training load
Here we discuss measuring training load and monitoring longitudinal training load through the means of a performance management chart.
It is important to note that training load may be monitored using rating of perceived exertion (RPE), heart rate or power. RPE and heart rate are internal load metrics, whereas power, and it’s derivatives, are considered external load metrics.
Power-based metrics, Heart Rate & RPE are all valuable for load monitoring
Although power-based load metrics have become widely popular, there is currently no peer‑reviewed evidence demonstrating that power‑based longitudinal load monitoring is more effective than methods using heart rate (HR), rating of perceived exertion (RPE), or subjective feeling.
Simply asking the athlete ‘How do you feel?’ can elicit valuable feedback
In fact, our recent (unpublished) data suggest that simple subjective wellness questions may, in some cases, be more sensitive for the early detection of overreaching compared with power‑based metrics. We have covered our latest coaching practices with regard to Internal Load Metrics in part 2 of this Training Load Monitoring series here.
Power-based metrics are still very valuable and remain the focus for this article
Nevertheless, power‑based load metrics remain a valuable component of athlete monitoring and should not be overlooked. In this article, we will therefore focus our discussion on the use of power‑based longitudinal load monitoring.
Within our short course material we include a monitoring template to be able to conduct monitoring, as discussed here, but by simply using RPE.
1. Session Training Load
- Normalised power (NP),
- Intensity factor (IF)
- Training Stress Score (TSS)
are all registered trademarks of Peaksware training systems, and terms originally developed by Dr. Andy Coggan and Hunter Allan (Allan and Coggan, 2010). Peaksware is the parent company that owns TrainingPeaks, which gave rise to the popularity of these metrics.
Normalised Power
Your normalised power is a weighted average power which was developed to represent the physiological cost equal to the particular session or effort. Therefore if your NP was 300 Watts for a training session or effort, it implies that the session or effort was equivalent to maintaining the same constant power (300 watts) for the same duration. When riding at varied power, as is typical during a mountain bike or road ride on hilly terrain, your average power would be much lower than your normalised power, and therefore using normalised power when power is extremely stochastic, is a better gauge of effort.
Intensity Factor
Your intensity factor (IF) is simply your NP divided by your FTP. As previously discussed, your FTP is your functional threshold power and roughly equal to a power you are able to sustain for a prolonged period of time (30 – 90 minutes). As highlighted in previous modules, your FTP is best determined through physiological testing.
Training Stress Score
Your training stress score (TSS) is a measure of individual session training load. It is calculated using the individual’s relative intensity, and duration of training session. It may represent the training load of any endurance sport and may be calculated from power, heart rate or rate of perceived exertion (RPE). However, it most commonly used to describe the training load of a training session performed with a power meter.
By definition, 100 TSS is the hardest you could possibly ride for 1 hour. You should only be able to achieve more than 100 TSS points if you ride for more than 1 hour. To calculate your TSS from your power meter data you need to first know your NP, and thereby your IF for the ride. You can calculate TSS by the following equation:
TSS= (NP/FTP)2 x Duration (Hours) * 100
2. Monitoring Longitudinal Training Load
The primary variables discussed in this section are:
- Acute Training Load (ATL),
- Chronic Training Load (CTL)
- Training Stress Balance (TSB)
Again, these are all registered trademarks of Peaksware (TrainingPeaks) training systems.
- Acute Training Load (ATL)
- ATL is your short term training load, normally during the last 7 days,
- Chronic Training Load (CTL)
- CTL is your longer term training load, normally the last 42 days.
- Training Stress Balance (TSB)
- TSB is simply the difference between your CTL and your ATL.
Crudely, we like referring to your ATL as your current fatigue state, your CTL as your current level of fitness, and your TSB as your current level of freshness.
Although TrainingPeaks (Peaksware) do not reveal how they calculate CTL and ATL, our personal experience, and that of recent research studies (Murray et al 2017), has shown that an exponentially weighted moving average (EWMA) of either acute or chronic load seems to track both performance and risk of illness and injury extremely well.
An EWMA of training load can be calculated as follows:
ATL = (ATLyesterday)(e(-1/k))+ (TSStoday)(1-e(-1/k))
CTL = (CTLyesterday)(e(-1/k))+ (TSStoday)(1-e(-1/k))
TSB = CTL – ATL
K= Time constant (7 for ATL and 42 for CTL)
3. Interpretation of the Performance Management Chart
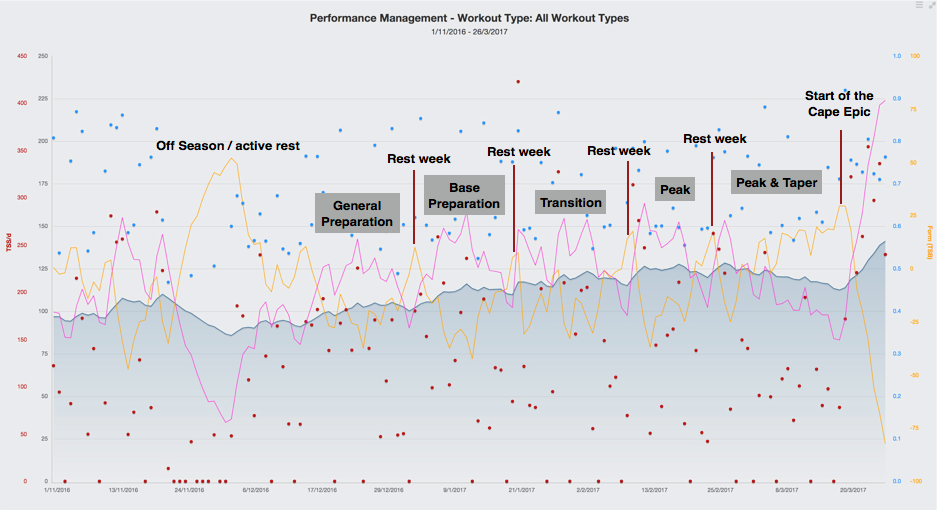
A performance management chart is a longitudinal graph showing CTL, ATL and TSB over a selected period of time. As shown in the figure below, the blue line (CTL) may be visualised as your fitness. The pink line as your fatigue, and the yellow line (TSB) your freshness or readiness to perform.
In reality, performance is the product of many inputs – a complex recipe
Athletes and coaches often make the mistake of over interpreting this model as direct measures of the simplified terms they are defined as; fitness, fatigue and freshness. In reality, performance is extremely complex and there is currently no model, which may account for all possible factors contributing to human variance.
There is no doubt that athletes with relatively low cardiovascular fitness levels will improve their performance as CTL is increased. The problem lies in that there is no direct means of determining the correct CTL for an athlete without prior training history and training data.
Optimal CTL values may vary from 70 TSS/day, for some competitive age group athletes, to as high as 140 CTL for pro tour riders. The best way to establish your optimal load is simply by continued performance monitoring.
As you increase your CTL, ensure that performance continues to increase. If your performance is stagnating, or even decreasing, this may be a sign that you have surpassed your optimal CTL range.
Similarly to your CTL, optimal TSB is also highly variable.
Certain athlete may perform better with a TSB in the range of +10 to +20, whereas some simply feel better at a TSB of -5 to +5. Again, correlating previous excellent performances with TSB on that particular day is one of the most effective way in which to ensure the correct TSB for peak performance
4. Practical aspects of the performance management chart
It is critically important that you monitor adherence to your periodised training plan.
Here is an example of an athlete preparing for the ABSA Cape Epic, Throughout the process training load was very closely monitored to ensure that the intended training load was correctly applied, and importantly that the objective of each rest week was achieved.
When evaluating your periodisation plan, ensure that each block or phase or training results in adequate stress. This can be seen as the ATL being greater CTL, during periods where the pink line is above the blue line.
Very importantly, between your blocks of training is when the athlete becomes “fresh”. Ensure that their training stress balance, or TSB, which is the yellow line spikes into positive values.
5. Conclusion
Training load monitoring is extremely important, but it is important that its value is understood: Training should never be prescribed with the sole purpose of achieving load goals.
Correct basic physiology principles must be followed to ensure that the correct systems are stressed, which triggers the required physiological adaptation.
Once the most correct physiological principles are followed, there is value in monitoring your load metrics. This gives the athlete a feedback mechanism to achieve optimal performance gains from training and structure good tapering strategies.
6. References:
Allen, H. Coggan A. Training and Racing With A Powermeter. 2nd Edition. Velopress. 2010.
Murray, NB. Gabbett, TJ. Townshend, AD. Blanch P. Calculating acute:chronic workload ratios using exponentially weighted moving averages provides a more sensitive indicator of injury likelihood than rolling averages. BR J Sports Med. 2017. 51(9): 749-754.