Monitoring Cyclist Training Load Part 2: The Submaximal Fatigue Test & Internal Load Metrics
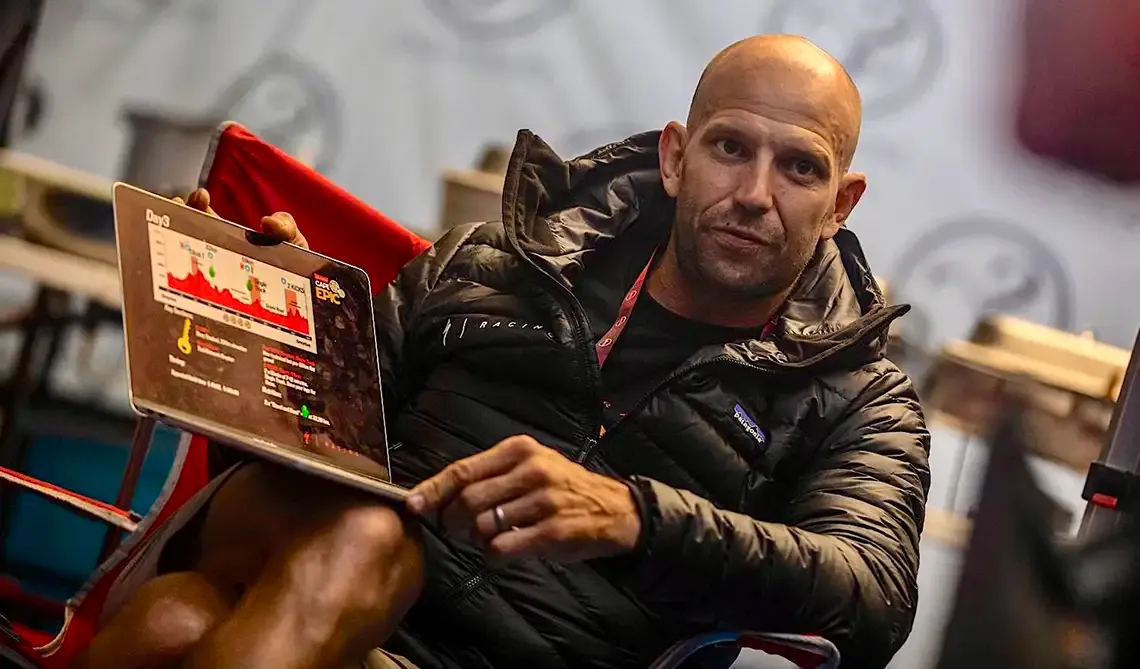
The above image is courtesy of Tread Media and was first published here.
In Part 1 of this series on monitoring training load, we wrote about incorporating external load (i.e. power based metrics). The focus of this post is integrating internal load metrics (with external metrics), to understand athlete progression, recovery, and readiness to perform.
As cycling grows in popularity and professionalism, understanding and managing training load is more critical than ever. Although power meters and their metrics are now widely adopted by athletes, ranging from recreational to professional, many coaches and self-managed athletes continue to overlook basic training principles.
To truly understand an athlete’s response to training, internal load metrics, such as rating of perceived exertion (RPE), heart rate (HR), and subjective wellness scores, should be integrated into a holistic monitoring approach.
Build a Holistic Picture of Wellness & Athlete Fatigue
At Science to Sport, one of our fundamental coaching principles is to recognise that training load is not merely what is done (external load), but how the body responds to it (internal load).
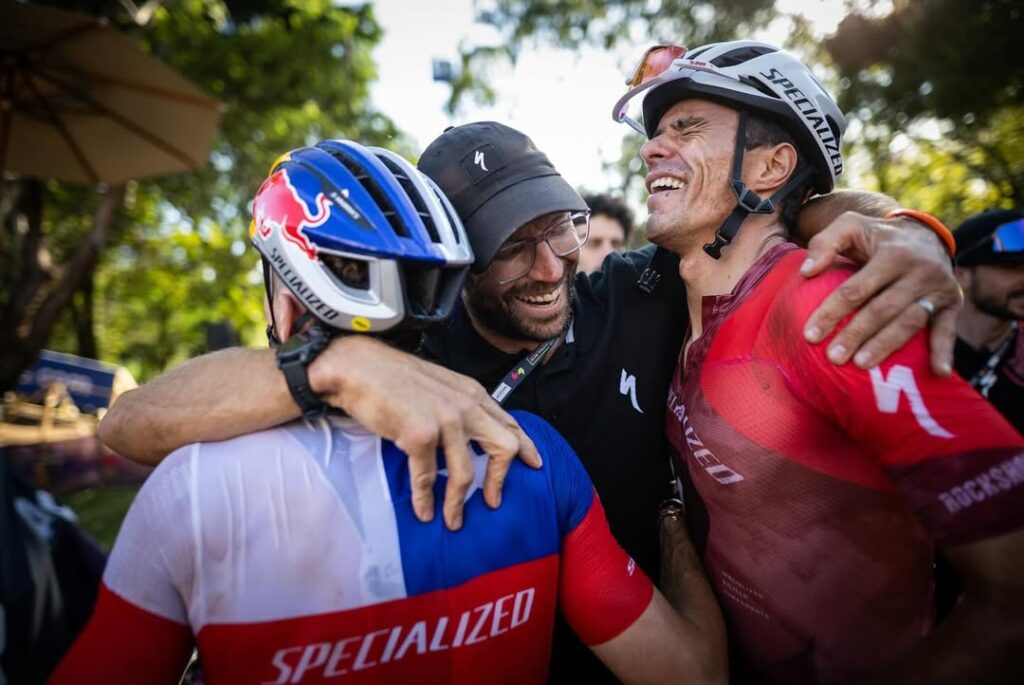
From the author’s Instagram & courtesy of Specialized Factory Racing.
What is Load Monitoring
Training load monitoring is the synthesis and analysis of either internal or external variables. These may be either directly or indirectly related to, or affected by training. The point of monitoring is to balance stress and recovery to optimise performance while minimising illness or injury.
Historically, coaches relied on observational cues and athlete self-reporting, but by the time an athlete reports feeling tired or weak, it’s often already too late to prevent performance decline or injury.
Today, a data-rich ecosystem allows for more refined monitoring, yet interpreting this data meaningfully remains the challenge. The concept of load must be dissected into external load (the work done) and internal load (the physiological and psychological cost of that work).
External Load Metrics
Power output has become the gold standard in cycling for quantifying external load. It is
- objective,
- reproducible,
- unaffected by motivational or environmental variables.
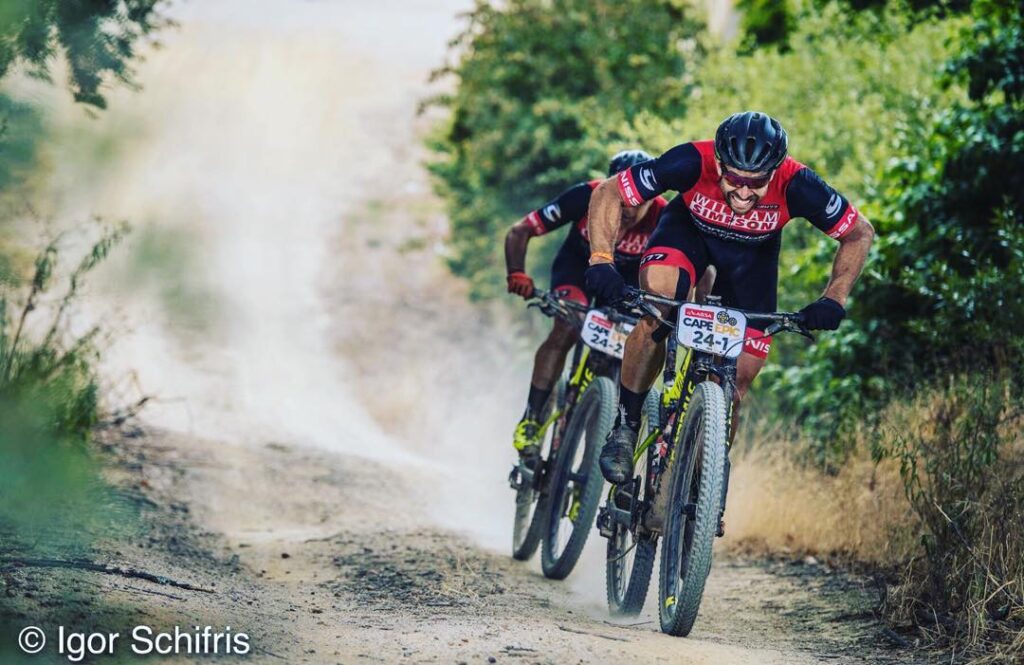
From the author’s Instagram – seen here field testing the structural integrity of his bike.
Common power-based metrics include:
- Training Stress Score (TSS),
- Chronic Training Load (CTL),
- Acute Training Load (ATL),
- Training Stress Balance (TSB).
These measures allow coaches to visualise training trends, anticipate periods of peak form, and flag overreaching. However, they do not account for individual variability in stress response, recovery status, or environmental stressors (e.g. heat, altitude, travel).
Internal Load
Internal load metrics provide crucial insight into how the athlete is coping with the imposed training load.
Internal Load Metrics
Subjective Wellness & The Submaximal Fatigue Test (SFT)
We have put together a separate how-to explainer here, detailing how to implement the S2S Submaximal Fatigue Test protocol.
How we integrate load monitoring at Science to Sport
S2S Coaches integrate weekly subjective wellness, and/or a submaximal fatigue tests (SFT). Our subjective wellness comprises of only five simple questions. We document:
- Fatigue
- Sleep
- Stress
- Mood
- Overall feeling
We previously used longer, validated questionnaires (such as the DALDA), but found that the difficulty in obtaining consistent feedback from anything beyond a few targeted questions outweighed the potential benefits.
Once feedback is quantified, we flag responses outside a given standard deviation. These flags often appear before performance is affected, and addressing the flags early is an important step in managing any athlete.
How S2S implements our Submaximal Fatigue Test
The SFT test is designed as a non-invasive submaximal performance test which can be included regularly, with minimal added load and stress to the athlete. The test is short and relatively easy to do: simply hold a moderate-to-hard effort for 3 minutes.
This effort is standardised at 110% of FTP (Functional Threshold Power). FTP is the power an athlete can sustain for a prolonged duration (approximately 45-75 minutes).
After the 3 minute effort, the athlete reports their exertion on the original Borg RPE Scale and reports how long they felt they would have been able to hold this power (Time to Exhaustion; TTE).
By triangulating:
- power,
- perceived exertion,
- heart rate,
we get comprehensive insight into an athlete’s performance and potential signs of over-reaching.
When the athlete reports perceived exertion, they also complete the same five subjective wellness questions. These are often critical in giving the coach the full picture of an athlete’s wellness and levels of both mental and physical fatigue.